What is Flowing Software?
Flowing Software is a free-to-use flow cytometry data analysis platform developed at the Turku Bioscience Centre by Perttu Terho. The software has been downloaded over 150,000 times since it was first released. Its stated goals are to provide a platform that combines high throughput analysis with usability. If you would like to try out the software, it can be downloaded on the Turku website.
Pros
- Free to use
- Quite popular for free software with over 150,000 downloads
- Often cited in the scientific literature
Cons
- Windows only, no support for Mac or Linux
- Not in active development. Its latest release is from 2013, over 10 years ago. The author has stated there will be no more updates. So if you need a bug fixed or a new feature added, you will be out of luck.
Flowing Software vs Floreada.io
| Flowing Software | Floreada.io | |
|---|---|---|
| Basics | ||
| Cost | Free | Free |
| No Installation | ✗ | ✓ |
| Active Development | ✗ | ✓ |
| Operating System | ||
| Windows | ✓ | ✓ |
| MacOS | ✗ | ✓ |
| Linux | ✗ | ✓ |
| Features | ||
| Rectangle Gate | ✗ | ✓ |
| Polygon Gate | ✓ | ✓ |
| Ellipse Gate | ✗ | ✓ |
| Quad Gate | ✓ | ✓ |
| Overlays | ✓ | ✓ |
| Manual Compensation | ✓ | ✓ |
| Autospill Compensation | ✗ | ✓ |
| Ratio Parameters | ✓ | ✓ |
| Cell Cycle | ✓ | ✓ |
| Kinetics | ✗ | ✓ |
| tSNE | ✗ | ✓ |
Flowing Software Tutorial
We at Floreada.io are big supporters of all free scientific software. While we feel our flow cytometry analysis software at Floreada.io is better, faster, and easier to use than Flowing Software, some may prefer alternatives. There is not much written documentation from the Flowing Software developers on how to use their software, so we have a brief tutorial for those who wish to try it out. They do provide a video tutorial.
Where to download Flowing Software
The first problem you may encounter with Flowing Software is finding the correct place to download the official version. Since the software is not actively developed, the download link on the old website no longer works and just redirects you to a different page on the site. There are a few unofficial downloads that you can find, but most of them are pretty sketchy. We would recommend using the download hosted on the Turku website. The last version released is Flowing Software 2.5.1. That release is from a decade ago and the software author is no longer doing any more updates to it.
General Principles of Flowing Software Analysis
Most analysis in Flowing Software is done by creating tools and attaching them to a plot. When you create a new tool there is a small red band at the bottom of its containing box. You can click and drag this red band to connect the tool to plots to do things. The tools can also be dragged around the workspace by dragging them from their borders. In this guide, we try to go through the tools and document their usage.
Visualization Tools
Opening FCS Files in Flowing Software
Flowing Software is built around the concept of "tools". Usually doing analysis consists of creating and linking together multiple tools. To view an FCS file, in the Main panel, select "Create"->"Visualization tools"->"Dot Plot". This will add an empty dot plot box to the layout. Click on the plot to select it and then you can click "File"->"Open FCS", to select an FCS file on your computer to open. You can resize the box and move it around the layout.
Changing X/Y Axes
To change the X or Y parameter in the plot, right-click the axis name and select the appropriate parameter.
Statistics
To view statistics for a population, right-click on a plot and select "Create Statistics". This will bring up a new window that will list several statistics. You can add or remove statistics from the window by right-clicking on the statistic window itself. The following statistics are available:
- Events
- % of Vis
- Mean
- GeoMean
- Median
- CV
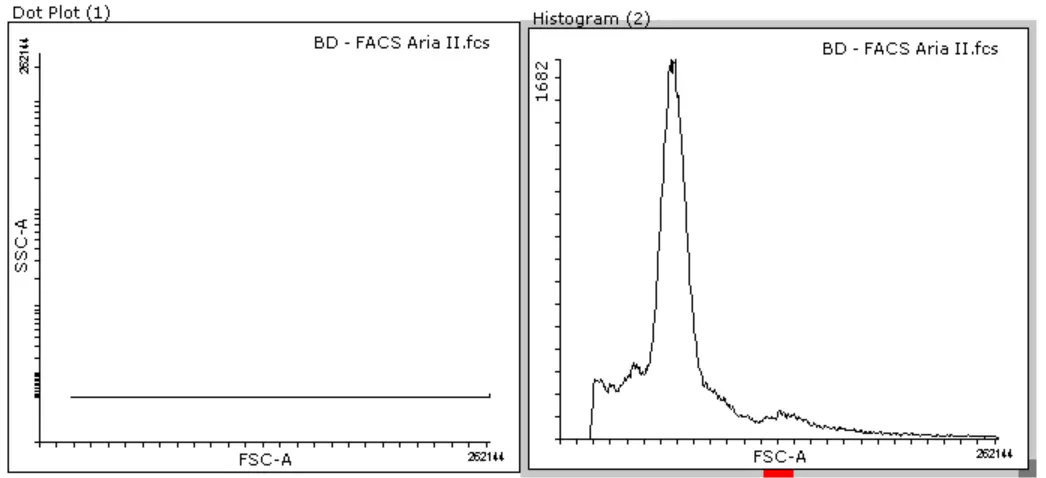
Histograms
Histograms are created in Flowing Software with a separate tool from plots. Select "Create"->"Visualization tools"->"Histogram". Just like with plots, you can change the x-axis by right-clicking on it. With histograms, you can also change the scale of the y-axis by right-clicking there.
Histogram overlays are created by yet another tool which you can select at "Create"->"Visualization tools"->"Overlay Histogram". Once you create an overlay tool, you must also make separate Histogram tools for each file that you want to overlay. Then drag each of their red bars to the Overlay tool to connect them all.
Note
Histograms are much simpler to work with in Floreada.io. In any plot, you can switch to a histogram view by selecting "Histogram" as the parameter for the y-axis. Overlays can be created in one easy step dragging and dropping populations onto a histogram plot.
Creating Gates
In Flowing Software, you can create a polygon gate by right-clicking on a dot plot and selecting "Create new region". Once a gate is created you can view only the events in the gate by right-clicking on the plot, selecting "Show population" and then choosing the population for the gate. The gate will appear in the "Populations" panel to the upper right of the screen. You can right-click on the population there to rename it and change the representing color for the population.
Note
In Floreada.io you have more options for gates than Flowing Software, including Rectangle, Ellipse, and Boolean gates.
Metadata Tools
Metadata Viewer
The metadata viewer tool is used to see more information about an FCS file. Once you create the tool you can connect it to a plot to view the metadata which includes:
- Cytometer
- Total Events
- Events/Second
- Parameters
- The Begin, End, and Total Time for the run
- The Well, Experiment, Plate, and Tube Name
Compensation Viewer
You can create a compensation viewer and connect it to a plot to see the compensation matrix that has been applied. The matrix is not user-editable
Parameter Data Viewer
The parameter data viewer can be connected to a plot for viewing the minimum and maximum values for each parameter.
Keyword Viewer
The keyword viewer tool can be connected to a plot to view FCS keywords in the file. When you first connect it, it will not show anything. You have to then right-click on it and select "Select Keywords". That will open up another window where you can select all of the keywords that you would like to be included in the viewer. Once you accept the selections, the tool will display the values for all the keywords you want.
Parameter Modification Tools
Change Parameter Names
This tool can be used to change a file's parameter names to whatever you want. Start by creating the tool and connecting it to a plot. Once you do that you can right-click on the tool and select "Edit Modifications...". A window will pop up where you can do the modifications. You can right-click in the "Original Name" cell to bring up a current list of parameters. Once you select the one you would like to change you can input the new name in the "Modified Name" cell. Finally, select "Save Modifications" to apply the new name.
Change Lin/Log Visualization
You can also change the scaling transform for an axis in the Main panel. Select "Create"->"Parameter modification tools"->"Change Lin/Log Visualization". Once you create a Lin/Log tool, you have to connect it to the plot you want to modify by selecting the tool and dragging the red band to the plot. Once the tool is connected you can right-click it and select "Edit Lin/Log Modifications". That will bring up a new window where you can edit the parameter scaling. If you right-click on the "Parameter Name" box you can select from the current plot's parameters. Then you can select between a linear or log transform.
Note
Changing axes is much simpler in Floreada.io than in Flowing Software. To change the transform for an axis in Floreada you just click on the axis. A window will appear that lets you easily change the parameter's transform. You also have more options available, including Locigle transforms, which may help with negative value events, as well as more fine-grained control over the exact transform you are using.
Data Modification Tools
Virtual Gain
Gain allows you to apply a multiplier to the values for events. After you connect a Virtual gain tool to a plot, you can right-click on it and select the parameter you wish to apply the gain to. You can then right-click on the tool again to set two other values:
- Define Multiplier: The old event values will be multiplied by this number to get a gained value
- Define value to Add: This will be added to the event value
Note
In Floreada.io gain is created using custom parameters. You can see how to do it in Example 1 in the Custom Parameter documentation
Compensate Data
The Compensate Data tool can be used to apply post-acquisition compensation. The process is a little tedious as the compensation matrix must be generated manually but it does work. Once you connect the tool to a plot you can right-click on it and select "Edit Modifications". You will have to manually specify which parameters are spilling over into which other parameters and then specify an initial spillover percent. After you save the modifications you can fine-tune them with the +/- buttons on the tool. It is still a difficult process. If you have just a few parameters to apply compensation to it may be adequate, but for more than 3-4 parameters it's probably unusable.
Note
Post-analysis compensation in Floreada.io is based on the Autospill algorithm and is completely automated. You do not have to manually adjust all the parameters individually. You can learn more in the Compensation documentation.
Data Reduction Tools
Reduce Event Number
This tool is used to downsample the events of a population. This can be helpful if you have a large file with many events and calculations that are taking too long to perform. Once you connect the tool to a plot, there are a few options to choose from. If you right-click on the tool you can choose between downsampling by an absolute number of events ("Define the number") or a percentage of events ("Define the percentage"). You can also select whether you want to take the sampled events evenly through the file or if you want to just take the first events in the file.
Region Control Tools
Move Regions over Negative and Positive Populations
This tool automatically attempts to find the negative and positive regions of a histogram. To use it you have to do a little bit of setup. First, create a Histogram tool and then create two regions on it. Next, create the "Move Regions over Negative and Positive Populations" tool and connect the histogram to it. Note that for this tool you connect the histogram to it, not the tool to the histogram. Finally, right-click and select "Active Control". The algorithm will then run and move the regions that you drew to the areas it thinks are negative and positive.
Move Region to Peak
This tool automatically moves the region in a histogram to the peak of the histogram. First, create a new histogram tool and create a region. Next, create a "Move Region to Peak" tool and connect the histogram to it, not the tool to the histogram. Finally, right-click and select "Active Control". The region should move to be centered over the histogram peak.
Cell Cycle
The Cell cycle tool is used to estimate G1, G2, and S phase populations for a cell cycle experiment. To get started you have to set up a histogram with three regions drawn on it. Then create a cell cycle tool and connect the histogram to the tool, not the tool to the histogram. Then right-click on the tool and select "Active Control". The regions should move to estimate the three phases. There are also a few options to calibrate.
- Define G2 peak multiplier - This is generally where to look for the G2 peak. It is usually 2, which means twice the value of the G1 peak (twice the amount of DNA)
- Define G2 width multiplier
Note
Cell cycle analysis in Flowing Software is difficult to use and probably not that accurate. Floreada.io has a much more sophisticated cell cycle platform based on the Watson Pragmatic model.
Calculation Tools
Calculate Ratio of Two Parameters
Sometimes it is useful to create a new parameter that is the ratio of two other parameters. This tool can help do that. Create the tool and connect it to a plot. There are then multiple parameters that you will have to configure. Right-click on the ratio tool to bring up a menu. The following options are available:
- Select Nominator - The parameter to be used as the nominator
- Select Denominator - The parameter to be used as the denominator
- Define Multiplier - A multiplier (gain) to be applied to the result
- Parameter Max - Once the new parameter is created, this option sets the axis range. You can choose to pick an absolute number yourself or have the software automatically pick a range for you
- Define Parameter Name - Set the name for the new parameter
- Visualize in log scale - toggles between linear and log scale for the new parameter
Layout Tools
Tool Group
The Tool group is a box that you can drag other tools into. Once they are in there you can drag the whole group around as one unit which can be helpful when organizing your layout.
Conclusion
If you want us to add anything to this tutorial or have any questions about Flowing Software, please feel free to reach out. Flowing software is great and we support all free software that helps people do analysis. We do think Floreada.io is much better software though, so if you are using Flowing Software and haven't tried Floreada.io, give it a try.