Free Flow Cytometry Software
Flow Cytometry is everywhere today. Easy free ways to view flow cytometry FCS files are not. There are many great commercially available software applications that allow not only for data visualization but also advanced statistical analysis of the data. Unfortunately, they cost hundreds to thousands of dollars. Most of the time the price is so big that they don't even put the quote on their website. Even with a paid license, there are usually limits placed on the number or location of computers that the software can be used on. This is acceptable for large labs and big companies, but smaller groups who are more limited on resources may not be able to use them.
Given the importance of flow cytometry to so many different scientific fields in today's world, analysis software that is usable by all should exist. There have been several projects that have sought out to create a free software analysis package for FCS files. Some are better than others. We are here to go through the biggest and most complete free flow cytometry software available and discuss their pros and cons.
We will look at and comment on the following aspects of each piece of software:
Software Design
We were programmers long before we did flow cytometry. We will give a brief, high-level description of the important software design decisions that were made by the software programmers and discuss the trades offs of those decisions in general terms.
Installation and Setup
We will take a look at what it takes to get started using the software. What dependencies does it have that the user needs to set up? How much personal information does the user need to provide? Is the software web-based or does it require you to download executables?
Ease of Use
What does it take to get a dot plot to show up on the screen? How easy is it to draw gates or change the axis? What resources do the authors provide to help you through the process of getting started with their program?
Features
There are a lot of features that are pretty standard that all flow cytometry analysis software should be able to perform. Then there are some nice to have features that are helpful in a lot of situations. Finally, there are some very specific features that most people don't really use at all. We see how each of the programs stack up.
Visuals
One of the major purposes of flow cytometry analysis software is to visualize data. So, how nice does the data look? We will open up a test file in each program and give you screenshots of dot plots and histograms. The images displayed will be the default view that each program gives for a dot plot and histogram.
Performance
There can be a lot of computation that is involved when loading FCS files and calculating gates and statistics. The speed at which this is done depends a lot on the software design decisions of the programmer. It depends on how big your usual FCS file is, how many you have open, and how many gates and stats you apply. If the program calculates inefficiently, the noticeable lag can be quite detrimental to the user experience. We will benchmark the different programs doing a few common tasks to get some estimate of their performance.
Development Status
As mentioned above, many of these programs have been around for many years. Unfortunately, some have not been updated in many years either. We will go through, as best as we can tell, what the current development status of each project is and if you should be expecting updates, bug fixes, and new features from the authors or not.
Special Aspects
Many of these programs have special things about them that make them really interesting. We will mention those here.
Software List
Summary
| Overall | Installation | Ease of Use | Features | Visuals | Performance | Status | |
|---|---|---|---|---|---|---|---|
| Floreada.io | ★★★★★ | ★★★★★ | ★★★★☆ | ★★★★☆ | ★★★★★ | ★★★★★ | ★★★★★ |
| FCSalyzer | ★★★★☆ | ★★★★☆ | ★★★☆☆ | ★★★★☆ | ★★★★☆ | ★★★★☆ | ★★★★☆ |
| FACSanadu | ★★★☆☆ | ★★★★☆ | ★★★★☆ | ★★☆☆☆ | ★★★☆☆ | ★★☆☆☆ | ★☆☆☆☆ |
| Red Matter App | ★★★☆☆ | ★★★★☆ | ★★★★☆ | ★★★☆☆ | ★★☆☆☆ | ★☆☆☆☆ | ★☆☆☆☆ |
| Cyflogic | ★★★☆☆ | ★★☆☆☆ | ★★★★☆ | ★★★★☆ | ★★★★☆ | ★★☆☆☆ | ★☆☆☆☆ |
| Flowing Software | ★★★★☆ | ★★★★★ | ★★★★☆ | ★★★★☆ | ★★☆☆☆ | ★★★☆☆ | ★☆☆☆☆ |
Floreada.io
- Overall Rating: ★★★★★
- Author: Us (Floreada Devs)
- Website: https://floreada.io
- Initial Release: Jan 2020
- Latest Release: Current
- Platforms: Web-based
Summary
Floreada.io is a web-based free flow cytometry analysis application. It is available from any platform with a web browser including phones and tablets. It is currently in very active development with a feature set that continues to grow.
Software Design
One of our motivations for starting Floreada.io is that existing software was not compatible with our computers and we wanted a cross-platform app. Therefore we decided on a web-based program that would work on any device with a web browser, including Windows, Mac, Linux, iOS, and Android. Although code that runs in a web browser will be slower than equivalent native code, we thought the tradeoff was worth it.
There are two general ways to run code on the web - the server-side (our computers) or the client-side (your computer). All existing flow cytometry analysis software that we could find uses a primarily server-side approach. Basically, all your data gets transferred to the server and when you add a gate or statistic or what to draw a dot plot, your computer will send a message to the server and ask it for the image data, or statistical information. The server will do any calculations and send your computer back the information it needs. This approach makes the already slow web-based approach even slower.
Floreada.io takes a completely client-side approach. When you load a file into your browser, it doesn't get sent to our computers. When you draw a gate, our computers don't do the calculation, yours does. We don't see any of your data. This allows us to be much more performant because we don't have to keep sending messages back and forth between our computers to display a dot plot for you.
Installation and Setup
★★★★★
Getting started with Floreada.io could not be easier. There is nothing to download or install. We don't need any of your information or have you sign up for anything. All you need to do is go to our analysis page and open up your files.
Easy of Use
★★★★☆
We tried hard to make the most common tasks in flow analysis easy and intuitive. Whether you are trying to draw a gate, switch files, change a parameter axis, or add a statistic, everything is point-and-click. Gates and stats can be dragged and dropped to and file you what. We hope everyone finds it very easy to use.
Features
★★★★☆
Our current feature set has all the basics most people will need to do basic manual flow cytometry analysis. We have plenty of more advanced features in the works that will be coming soon.
Display Types
- Dot Plot
- Density Plot
- Histograms
- Overlays
Gate Types
- Rectangle
- Ellipse
- Quadrant
- Polygon
- Boolean
Transforms
- Linear
- Log
- Logicle
- Hyperlog
Compensation
- Automatic
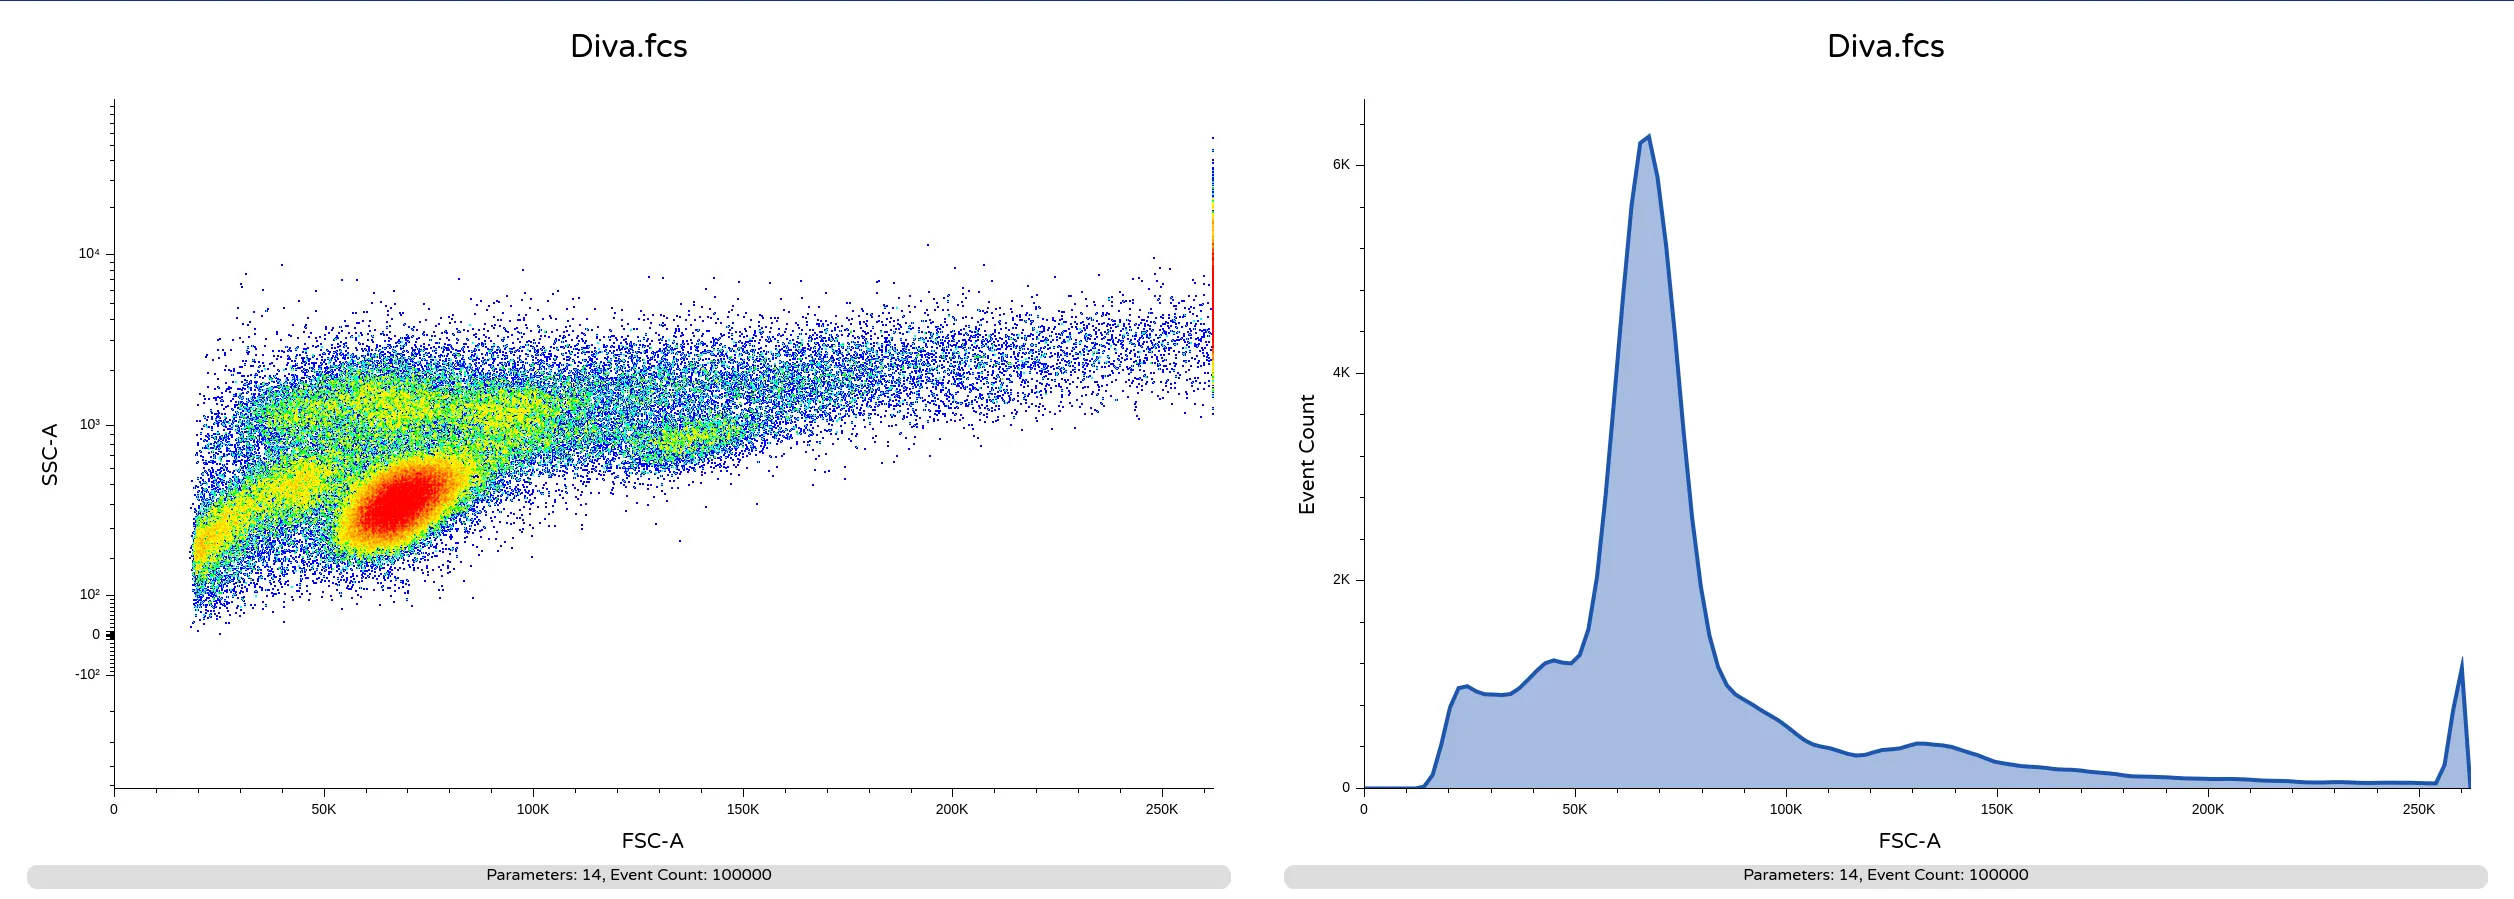
Visuals
★★★★★
We gave ourselves 5 out of 5 stars on visuals for obvious reasons. Continue down the page and look at the other programs displaying the same exact file. We don't think you will disagree.
Performance
★★★★★
We gave ourselves 5 out of 5 stars again here. In our benchmark test of loading a 4 million+ event file, Floreada.io displays the full file in less than 2 seconds on average. No other program we tested comes close in the benchmark and most others crashed when loading the file.
Development Status
★★★★★
We are continuously adding new features and improving the features that we already have. If you want us to add something, let us know.
Special Aspects
One important aspect of Floreada.io that we are proud of is the mobile experience of the analysis page. If you haven't tried doing flow cytometry analysis on your iPad or phone, give it a try.
FCSalyzer
- Overall Rating: ★★★★☆
- Author: Sven Mostböck
- Website: https://sourceforge.net/projects/fcsalyzer/
- Initial Release: Nov 2012
- Latest Release: Sept 2019
- Platforms: Windows, Mac, Linux
Summary
FCSalyzer is a Java program, which appears to be in active development, available for Windows, Mac, and Linux. It has a very good set of features for a free program although its user interface is difficult to use and navigate at times.
Software Design
FCSAlyzer is written in Java. Java gets compiled to Java bytecode which runs on a Java Virtual Machine. The JVM then translates the bytecode to code that your CPU understands. The major advantage of this is that you can run the same Java code on any platform that has a JVM. So the program will work on Windows, Mac, and Linux, and the author doesn't have to maintain separate versions for each platform. A downside is that because the JVM must go through the process of translating the bytecode to CPU code while the program is running, the program will be slower than a program that was specifically compiled to run on a platform.
Installation and Setup
★★★★☆
The process of installing FCSalyzer is relatively straight forward. Both the program and the source code is hosted on SourceForge here. The program is distributed as a JAR (Java Archive) File. To run the program you do have to have the Java Runtime Environment (JRE) installed. You probably already have that installed for other reasons but if you need it you can get it from Oracle here. FCSalyzer does not require you to sign up for anything or input any personal information.
Easy of Use
★★★☆☆
The first time that I tried to use FCSalyzer, I couldn't figure out how to open up a dot plot. It was similarly difficult to figure out how to change the axis for a parameter. Although the user interface may not be the most intuitive, FCSalyzer does have very good documentation which will help you get your bearings.
Features
★★★★☆
Display Types
- Dot Plot
- Density Plot
- Histogram
- Overlays
Gate Types
- Quadrant
- Polygon
Transforms
- Linear
- Log
- Logicle (Can't set parameters manually)
Compensation
- Manual
Visuals
★★★★☆
FCSalyzer can display dot plots, histograms, as well as overlays. The visuals are pretty average looking.
Performance
★★★★☆
FCSalyzer is written in Java and therefore is at some level trading speed for portability. In our objective test of opening a very large FCS file, it took FCSalyzer on average a respectable 36.05 seconds. Once the large file is open applying gates does come with a noticeable lag, but it had fairly good performance overall.
Development Status
★★★★☆
FCSalyzer still seems to be in somewhat active development. It was initially published in 2012 and has received multiple releases every year since then until 2019. Although it hasn't yet been updated in 2020, the developer is active on the programs SourceForge page and seems to be really active in helping users and tracking down bugs. The developer has done a great job and has been going strong for almost a decade at this point. FCSalyzer is one of the only free flow cytometry analysis software projects that remains active.
Special Aspects
FCSalyzer is free and open-source software. Its source code is available in a zip file alongside the program itself. It is licensed under the copyleft GNU General Public Licence version 3.
FACSanadu
- Overall Rating: ★★★☆☆
- Author: Johan Henriksson, EMBL-EBI and Karolinska Institutet
- Website: http://www.facsanadu.net/
- Github: https://github.com/mahogny/facsanadu
- Initial Release: Mar 2015
- Latest Release: Oct 2017
- Platforms: Windows, Mac, Linux
Summary
FACSanadu is a Java program, no longer in active development, available for Windows, Mac, and Linux. It has a nice user interface but its use is severely limited by its lack of features, specifically the fact that it only can display parameters on a linear scale.
Software Design
FACSanadu is also written in Java. Again, arguably the most compelling reason to use Java is its portability between platforms, knowing that you are giving up speed. FACSanadu chooses Java but still writes OS-specific code and releases separate versions for Windows, Mac, and Linux, which kind of defeats the point of Java in our opinion. It also does not use the built-in Java user interface elements (which do look pretty clunky), instead opting for a user interface based on the QT library, which most people will prefer.
Installation and Setup
★★★★☆
FACSanadu has packages available for Windows, Mac, and Linux. As it is a Java program, you will need the Java runtime installed on your system. You do not need to sign up or give out any personal information to download the application.
Easy of Use
★★★★☆
We found FACSanadu pretty easy to use. It does all the basics pretty well and is easy to navigate. It was easy to get a dot plot up and start drawing gates. It is missing some features but that did remove the extra clutter of a ton of buttons and actually helped its ease of use.
Features
★★☆☆☆
The reason that FACSanadu only got 3 stars for an overall rating is that it only supports linear scales. This will be a deal-breaker for most people. Not having a Logicle scale is probably acceptable for most but log scaling is a must-have.
Display Types
- Dot Plot
- Histograms
Gate Types
- Rectangle
- Polygon
Transforms
- Linear
Compensation
- None
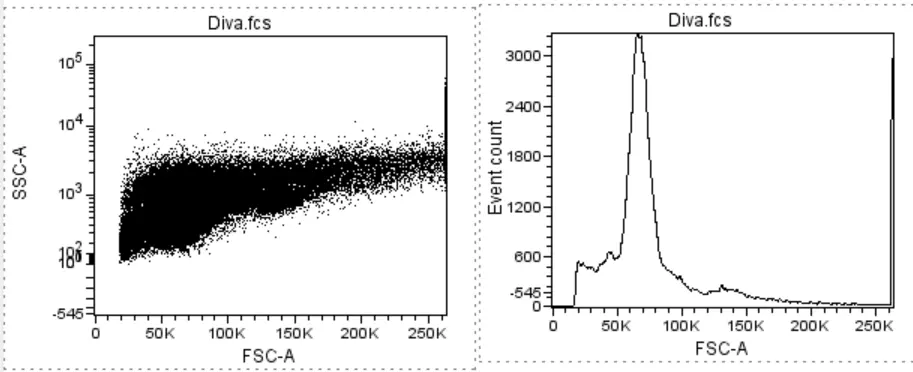
Visuals
★★★☆☆
The overall user interface looks pretty good, as it is QT based. The graphics images of dot plots are average. There is no axis scale on plots, which could be a problem for some.
Note that this is the same file that has been displayed previously. The dot plot looks different because FACSanadu displays the SSC-A parameter incorrectly on a linear scale when the FCS file specifies that it should be on a logicle scale.
Performance
★★☆☆☆
FACSanadu could not complete our speed test because it failed to open our testing file.
Development Status
★☆☆☆☆
According to the last commit on its GitHub page, the project has been dormant since 2017. It seems to no longer be actively developed and you should not expect future bug fixes or new features.
Special Aspects
FACSanadu claims to read native COPAS Biosorter files, although we did not thoroughly test this.
Red Matter App
- Overall Rating: ★★★☆☆
- Author: Mark Kelly
- Initial Release: Aug 2017
- Latest Release: Abandoned
- Platforms: Web-based
Update
This project is no longer under development.
Summary
Red Matter App is a web-based flow cytometry program, which was released in 2017, and does not appear to be in active development. It is very limited by the fact that without paying for a subscription, you are only allowed to upload 10 files per month to analyze. Some would likely need to upload more than 10 FCS files for one experiment alone.
Software Design
Red Matter App is a web-based program. This allows you to use the program on any device that has a web browser. So all operating systems are supported. But there are some downsides to this approach. Unlike Floreada that does all analysis on your own computer, Red Matter App transfers your file to its servers to analyze it. A downside of the server-side approach is that when you open a file or add a gate, your computer must ask their server to do the calculation and send back the stats. As a result, there is a noticeable lag between adding a gate and seeing the stats.
Installation and Setup
★★★★☆
Red Matter App is web-based and does not require you to install anything in order to use it. It only gets 4 out of 5 stars though because it requires you to give your name and email to get started and does not allow you to use the app at all without giving out your personal information.
Easy of Use
★★★★☆
Red Matter App was fairly easy to use. It does a good job of getting you set up and walks you through the file upload process. Once you have a file open, the normal workflow of gating is pretty easy to figure out. The one weird part about the workflow is that the app does not auto-detect when you make a change and requires you to hit an "Apply" button every time you want to changes to take effect. This is very likely to cut down on the number of server requests it has to make.
Features
★★★☆☆
Display Types
- Dot Plot
- Histograms
Gate Types
- Quadrant
- Polygon
Transforms
- Linear
- Logicle (Can't set parameters manually)
Compensation
- Manual (Applies Compensation in FCS File. Can not change or specify otherwise)
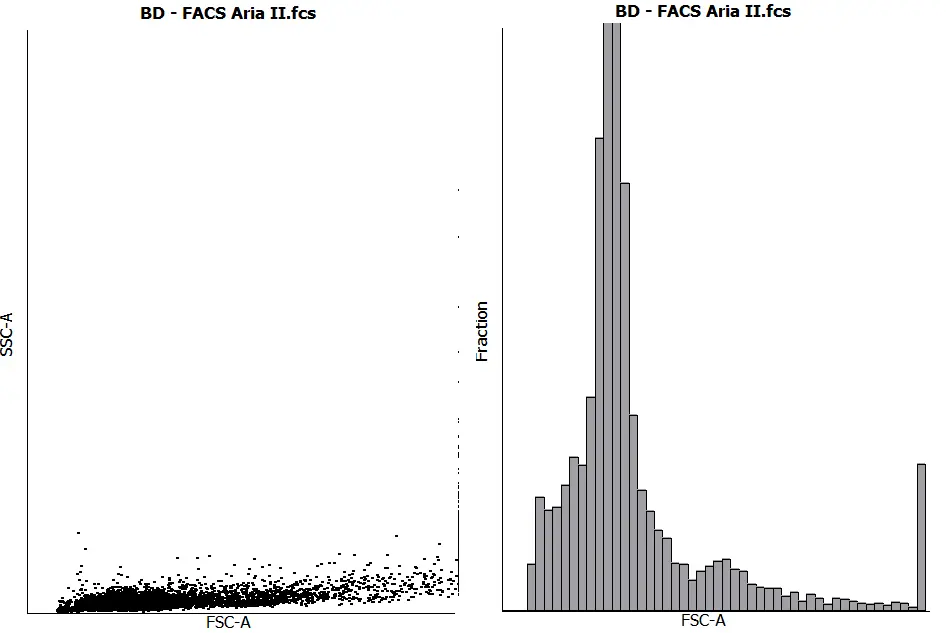
Visuals
★★☆☆☆
Red Matter App's user interface looks unpolished and disorganized. The plots themself are unique in that they use a "dark mode" type theme, where the normal dark and white aspects of the plot are reversed. We found it a little jarring.
Again, this is the same test file we have used previously, but Red Matter App does not display the SSC-A parameter on a logicle scale, instead of displaying a linear scale, causing the events to appear bunched at the bottom. There is a bi-exponential scaling option that you can manually select but even with that option, it does not allow you to manually input logicle function parameters and chooses default ones that result in poor scaling.
Performance
★☆☆☆☆
The file we use to test the speed of an app is a 4 million+ event file that is 200 MB+ in size. We were unable to perform the speed test because the maximum file size the Red Matter App is able to handle is 40 MB. So if you have FCS files bigger than that (about 1 million events or so), Red Matter App is not going to work for you. We also tried a smaller file with 500,000 events (about 17 MB). It took 7 minutes and 44 seconds to upload. Additionally, Red Matter App only displays a maximum of 200,000 events so files with more than that will be truncated.
As noted above, because of the server-side nature of the application, calculations have a noticeable lag when adding gates and other statistical operations.
Development Status
★☆☆☆☆
According to the Red Matter webpage, its beta version was released in 2017 and there have not been any additional updates since then. It does not appear to be in active development and is not adding any additional features. As of 2024, the web app seems to no longer be accessible.
Special Aspects
Red Matter App offers a paid version that allows the user to upload additional files.
Cyflogic
- Overall Rating: ★★★☆☆
- Author: Perttu Terho, Mika Korkeamaki, CyFlo Ltd.
- Website: http://www.cyflogic.com/
- Initial Release: Feb 2008
- Latest Release: Nov 2008
- Platforms: Windows
Software Design
Cyflogic is a free analysis program for Windows only, that is no longer currently in development and has not been for over a decade.
Installation and Setup
★★☆☆☆
The installation and setup process is a little more involved than other free analysis programs. In order to use it, you have to sign up for a free version on their webpage and input a bunch of personal information. Once you do that you get a Windows installation file that you can run to install it onto your system.
Easy of Use
★★★★☆
Cyflogic has a nice workspace and each plot pops up in its own window that you can easily move around and resize. The parameters on each axis can be changed by right-clicking on them. It reports to allow polygon gates but we could only find the quadrant gates easily. Navigating between multiple files could be better.
Features
★★★★☆
Display Types
- Dot Plot
- Density Plot
- Histograms
- Overlays
Gate Types
- Quadrant
- Polygon
Transforms
- Linear
- Log
- Logicle (Can't set parameters manually)
Compensation
- Manual (Reports compensation on their website but does not apply in-file compensation)
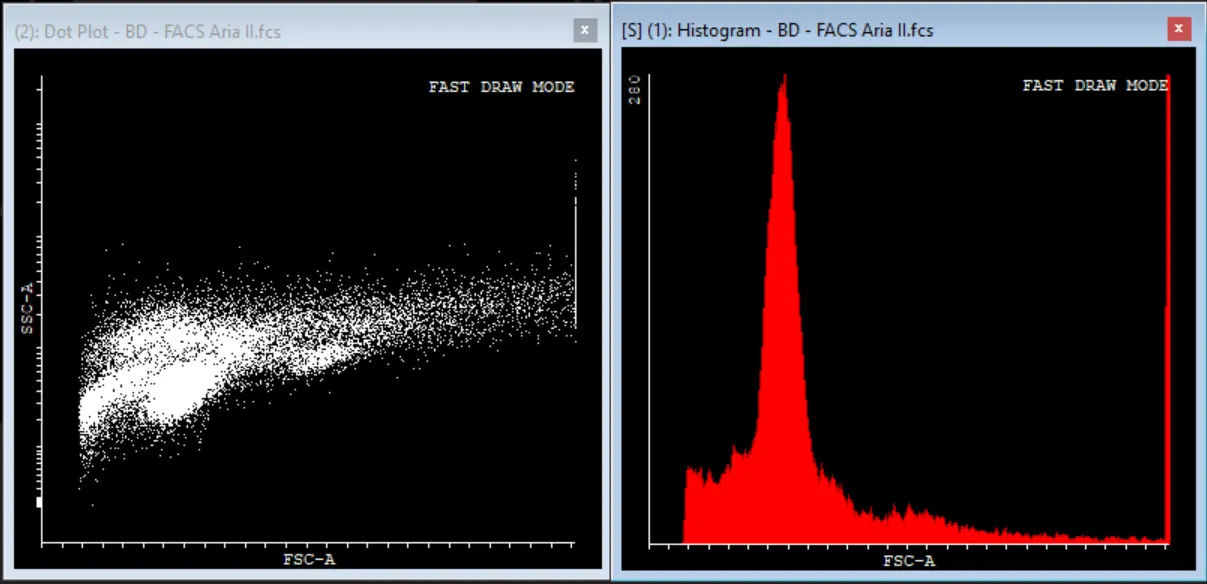
Visuals
★★★★☆
The default dot plot is displayed with inverted colors, but that can easily be changed by right-clicking on the plot. It has a great variety of different ways to display data. The axes have appropriate tick marks but are not labeled with values.
Performance
★★☆☆☆
When opening up our standard large file to test its performance, Cyflogic crashed. When using smaller files there was fairly minimal lag. Cyflogic also allows you to limit the number of events that it will draw which may help to limit the performance hit with huge files.
Development Status
★☆☆☆☆
Cyflogic is no longer actively developed and has not been for over a decade according to their webpage.
Special Aspects
Cyflogic does advertise a paid version but as the site has not been updated since 2008 we are not sure if that is still available.
Flowing Software
- Overall Rating: ★★★★☆
- Author: Perttu Terho
- Website: http://flowingsoftware.btk.fi/
- Initial Release: No Info
- Latest Release: April 2013
- Platforms: Windows
Summary
Flowing Software is a free analysis program that is no longer currently in development with no releases since 2013. It was created by the same person who made Cyflogic and shares many visual characteristics. It's much better software than Cyflogic though. It is available for Windows computers only.
Software Design
Flowing Software has no source code available that we could see so we are not positive of the exact design but it is a .NET app probably written in C#, as the errors it throws when it crashes are .NET errors. The .NET Framework is a Microsoft "managed code environment" which is why the program is Windows only. It is faster than a similar Java program but slower than a similar C program would be.
Installation and Setup
★★★★★
Flowing Software does a great job of making installation easy. Their Windows installer is easily available from their download page. You do not need to sign up or give out any information to get started.
Easy of Use
★★★★☆
It is easy to get a workspace open and start displaying FCS file plots. The workflow is pretty intuitive. The exception to this was the gating workflow which was not designed as well.
Features
★★★★☆
Display Types
- Dot Plot
- Density Plot
- Histograms
- Overlays
Gate Types
- Quadrant
- Polygon
Transforms
- Linear
- Log
- Logicle (Did not display correctly)
Compensation
- Manual (Does not appear to calculate all in-file compensation correctly)
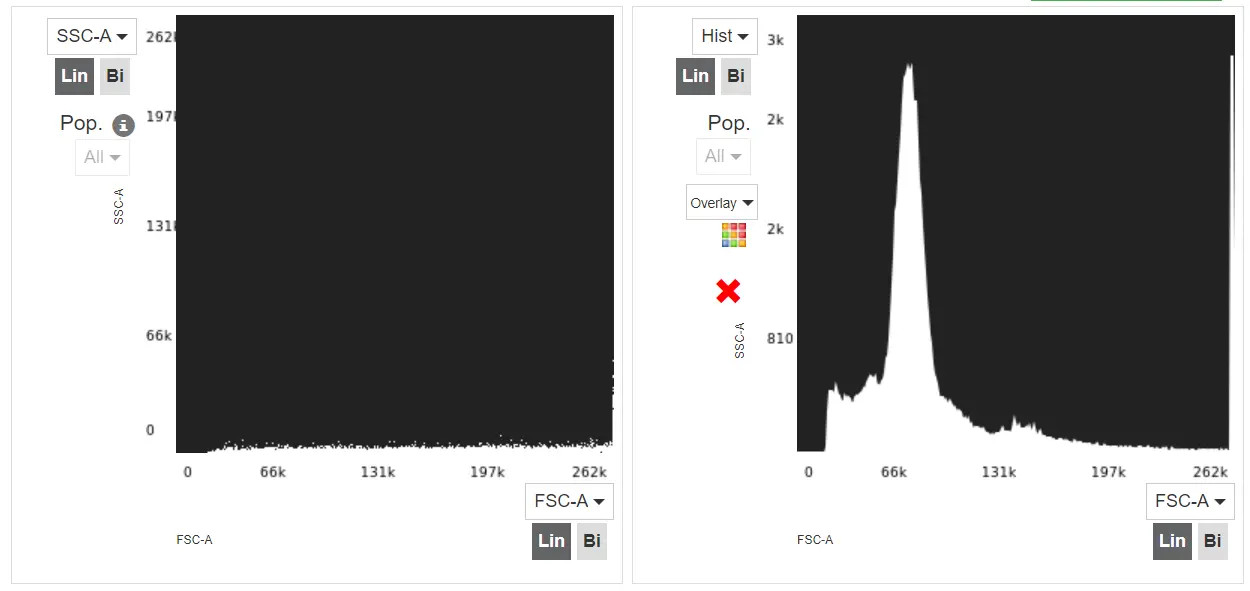
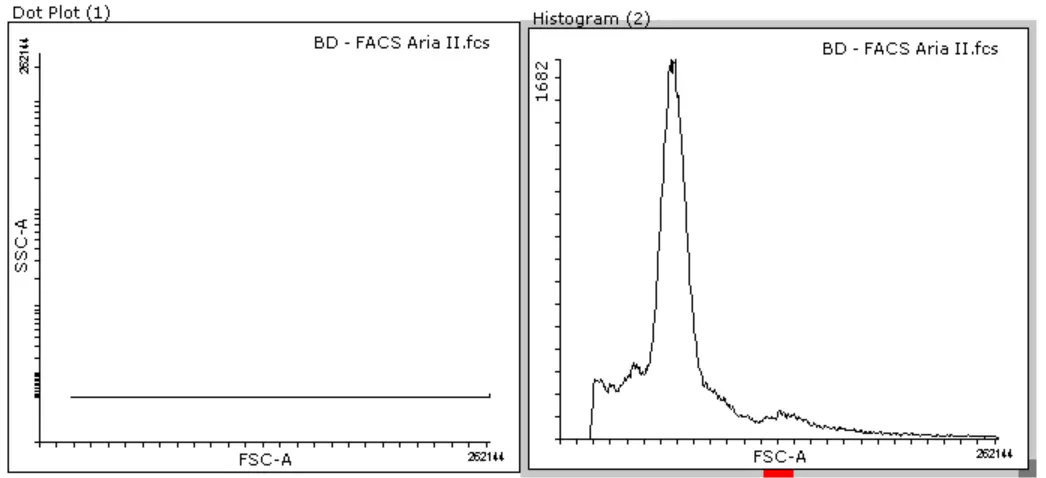
Visuals
★★☆☆☆
As Flowing Software was written by the author of Cyflogic, they display similarly appearing dot plots and probably share most of their graphics code. Overall, Flowing Software appears more polished than Cyflogic as you would expect. It also does not display plots with inverted colors, which is a welcomed change from Cyflogic.
Interestingly, however, whereas Cyflogic was able to correctly display our test file, Flowing Software is incorrectly displaying the Logicle scaling on the SSC-A parameter axis, resulting in basically a horizontal line. It does correctly put the parameter on a Logicle scale as seen by the axis tick marks but it likely has a bug in the Logicle scaling code.
Performance
★★★☆☆
Similar to Cyflogic, Flowing Software crashed when we tried to load our performance test file. Regardless we still did give it 3 out of 5 stars because the overall performance seemed good.
Development Status
★☆☆☆☆
Flowing Software does not appear to be actively developed and has not had a new release since 2013 according to the Download section of its webpage.
Special Aspects
Flowing Software does have a very good documentation page and multiple Youtube video tutorials to help you get started. It also has a lot of specialized features that some may find useful.
WinMDI
- Overall Rating: ☆☆☆☆☆
- Author: The Scripps Research Institute
- Website: https://winmdi.software.informer.com/2.8/
- Initial Release: No Info
- Latest Release: The Stone Ages
- Platforms: Windows
Summary
WinMDI only needs a summary. You almost certainly should not be using it. It is an extremely old 16 bit Windows program that was made before the FCS3.0 standard. It may have worked well decades ago but it is completely obsolete at this point. It probably won't even run on your computer. The only situation where it might be useful is if you have extremely old computers in your lab. Other than that find something more modern. The only reason we have it on this list is that it is often on other lists of free flow cytometry software (usually lists that haven't been updated in a while).
Free Versions/Trials of Commercial Software
Apart from free flow cytometry software from small developers, the big names in flow cytometry software usually have a free trial of their software that is available to try for 30 days.
Flow Jo
30 Day Free Trial
Flow Jo offers a 30-day free trial for you to try. They are very protective of their software and will require you to input hardware identification before they send you a temporary key. You can find the free trial here
FCS Express Reader
Reads FCS Express published files
If your colleagues have access to a full version of FCS Express, you can read files that they "publish" using a free tool - FCS Express Reader. You have access to most features available in the full version but you will only be able to access files that the full version has published. The FCS Express website has more information here
Kaluza (Beckman Coulter)
30 Day Free Trial
Beckman Coulter offers a free trial of its flow cytometry software, Kaluza, for 30 days. Again, you will need to fill out a bunch of forms to get access. You can start the process here on their website.
Cytobank (Beckman Coulter)
30 Day Free Trial
Beckman Coulter also has a free trial of its cloud-based platform, Cytobank, available as a 30-day free trial. You can find more information here.
Flowlogic Software (Miltenyi Biotec)
30 Days Free Trial
Flowlogic Software from Miltenyi Biotec also has a free trial version of their analysis software available for 30 days. They have the biggest forms of all to fill out. Head over to their website here to start signing your life away.
Conclusions
A lot of people, especially students, don't have the resources to afford an extremely expensive license or subscription to professional level flow cytometry analysis software. Without paying there are essentially two options: using a free trial of commercial software or using freely available software. Although many small free flow cytometry analysis software projects have been started, most have ceased active development many years or even decades ago. Floreada.io was started to fill this gap and create easy to use free analysis software that is accessible on all platforms. We hope you will give us a try - it's super easy to get started. Given how important flow cytometry has become to so many different scientific fields, there should be an easy free way to do simple analysis that everyone has access to. Come help us accomplish this goal. Get started here
Special Note
If you are one of the authors of software we have listed above, feel free to contact us if you want anything added or removed from what we said. If you have a free flow cytometry program that we didn't list here and you want to be added, let us know.